‘bistro’ Plots#
“Bistro” plots is a collection of “compound plots” allowing users to generate intricate charts without the need for extensive coding.
These plots build upon lets-plot’s core functionality, combining multiple geoms, scales, and settings into ready-to-use functions.
Correlation Plot#
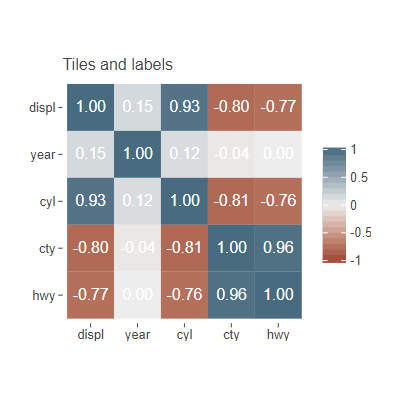
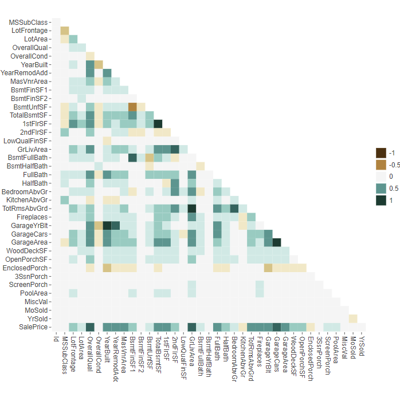
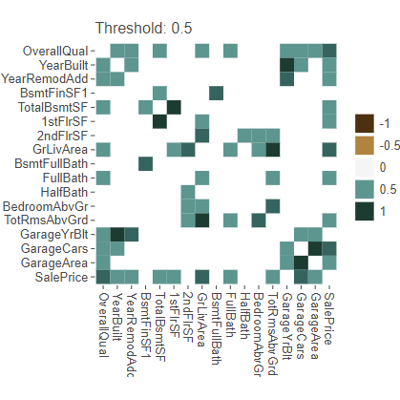
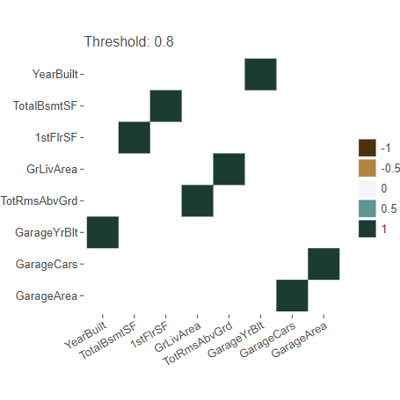
Examples:
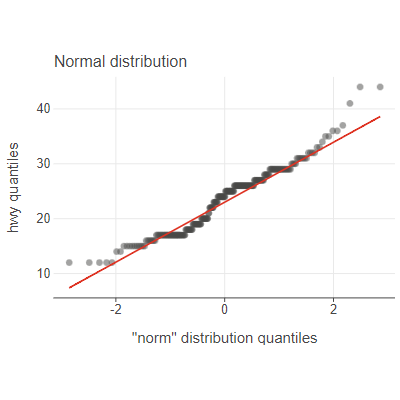
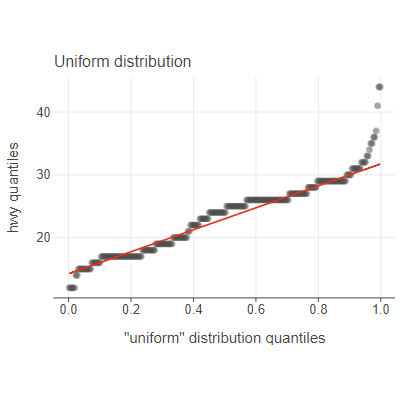
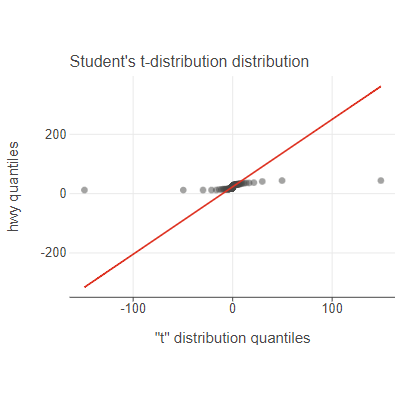
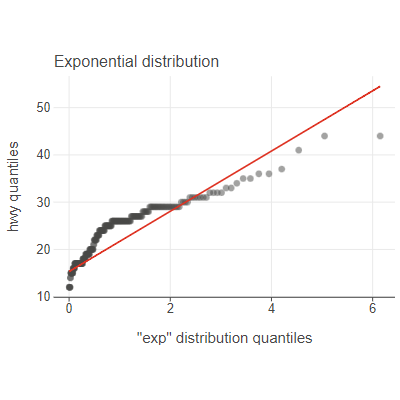
Q-Q Plot#
geom_qq(),
geom_qq_line(),
geom_qq2(),
geom_qq2_line(),
qq_plot()
Examples:
Joint Plot#
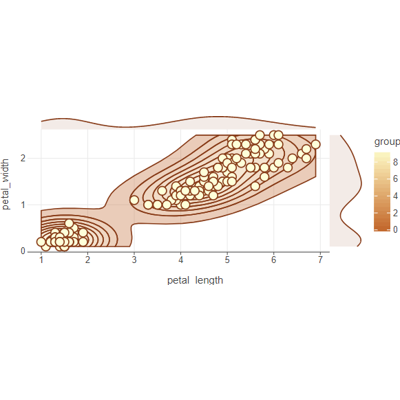
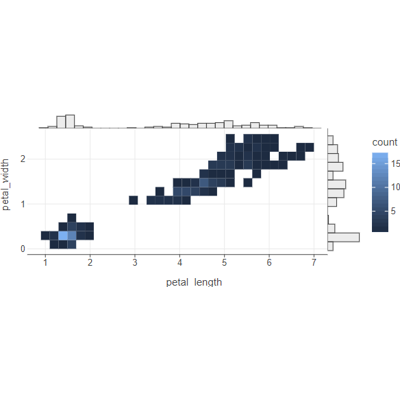
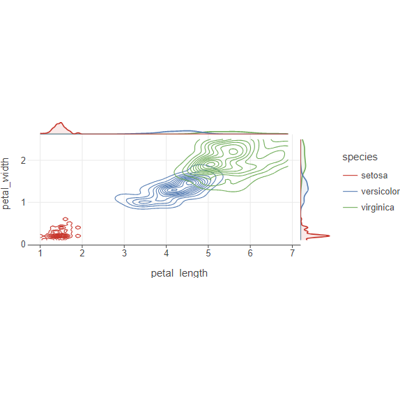
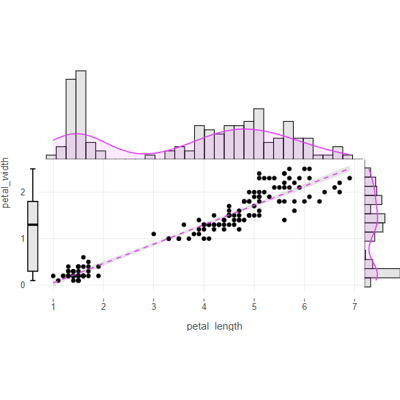
Examples:
Residual Plot#
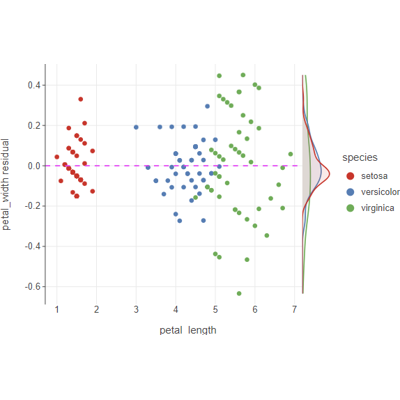
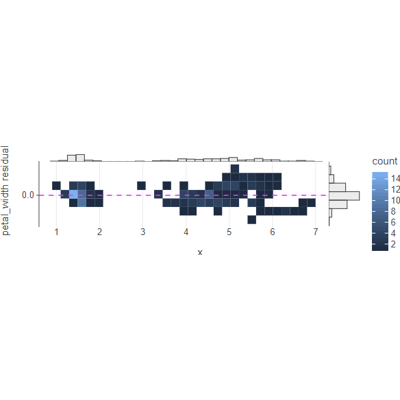
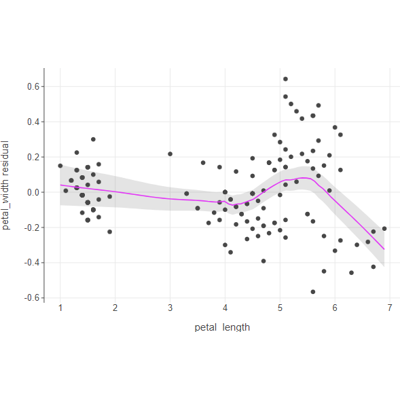
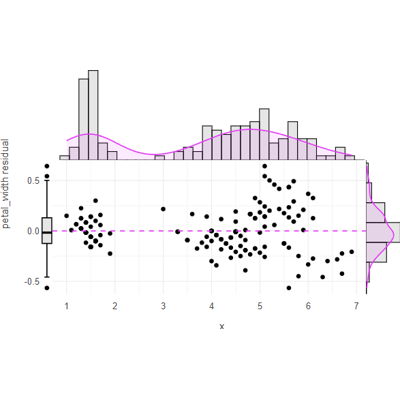
Examples:
Waterfall Plot#
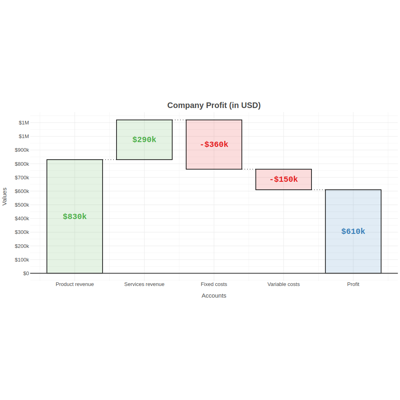
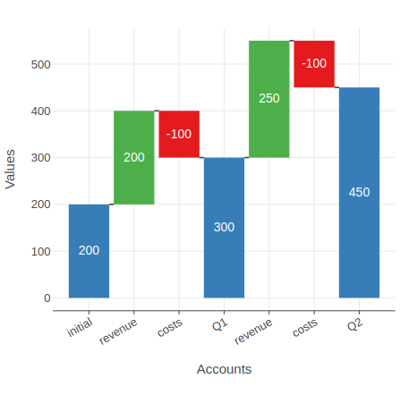
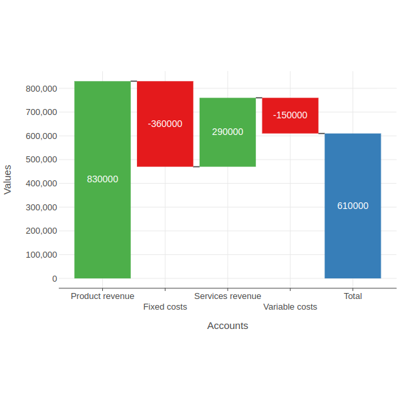
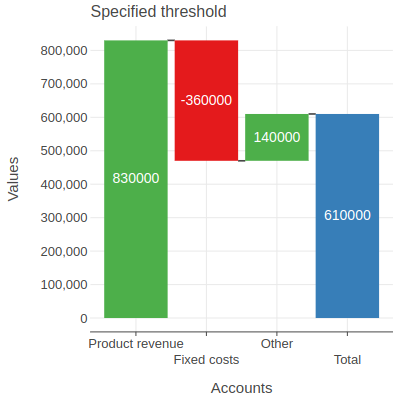
Examples: