Customize Legend Appearance#
import io
import requests

import pandas as pd
from PIL import Image

from lets_plot import *
LetsPlot.setup_html()
response = requests.get("https://raw.githubusercontent.com/JetBrains/lets-plot-docs/master/source/examples/cookbook/images/theme_legend_scheme.png", timeout=5*60)
Image.open(io.BytesIO(response.content))
df = pd.read_csv("https://raw.githubusercontent.com/JetBrains/lets-plot-docs/master/data/mpg.csv")
print(df.shape)
df.head()
(234, 12)
| Unnamed: 0 | manufacturer | model | displ | year | cyl | trans | drv | cty | hwy | fl | class | |
|---|---|---|---|---|---|---|---|---|---|---|---|---|
| 0 | 1 | audi | a4 | 1.8 | 1999 | 4 | auto(l5) | f | 18 | 29 | p | compact |
| 1 | 2 | audi | a4 | 1.8 | 1999 | 4 | manual(m5) | f | 21 | 29 | p | compact |
| 2 | 3 | audi | a4 | 2.0 | 2008 | 4 | manual(m6) | f | 20 | 31 | p | compact |
| 3 | 4 | audi | a4 | 2.0 | 2008 | 4 | auto(av) | f | 21 | 30 | p | compact |
| 4 | 5 | audi | a4 | 2.8 | 1999 | 6 | auto(l5) | f | 16 | 26 | p | compact |
Legend Position#
Parameters to customize the legend position and justification:
legend_position- the position of legends;legend_justification- anchor point for positioning legend;legend_direction- layout of items in legends.
p1 = ggplot(df, aes("displ", "hwy")) + geom_point(aes(color="cty", shape="drv"), size=5)
p1
# Draw legend below the plot area
p1 + theme(legend_position='bottom')
# Specify position, justification and orientation
p1 + theme(legend_position=[1, 1], legend_justification=[1, 1], legend_direction='horizontal')
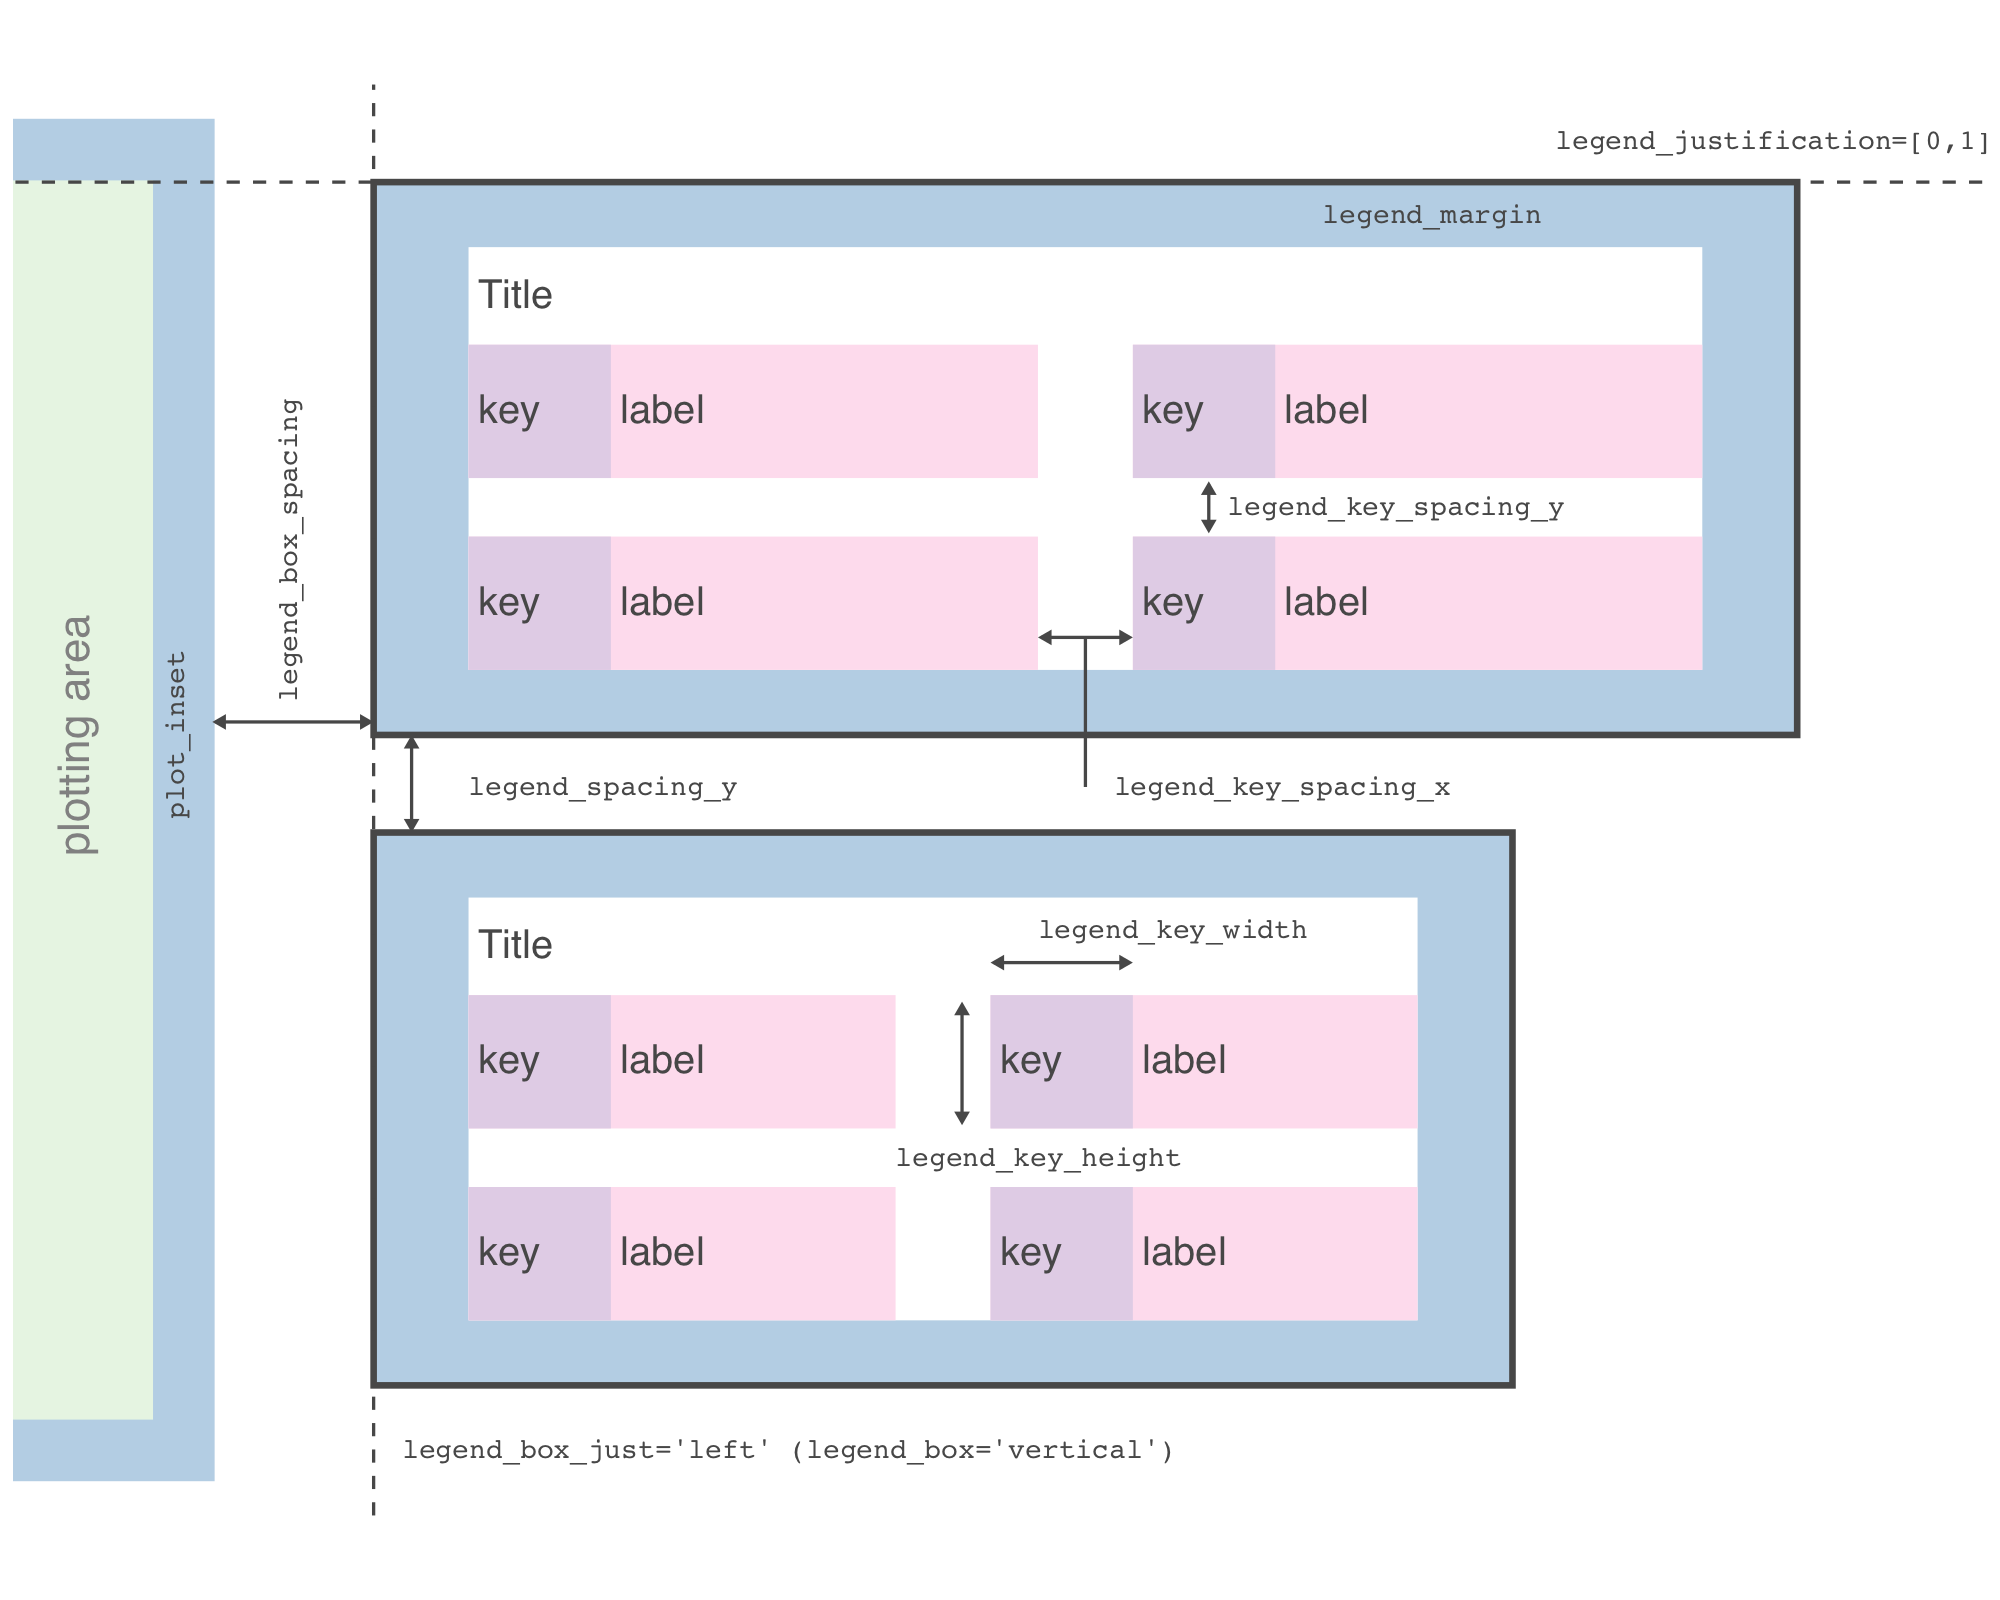
Legend Spacing and Margins#
Parameters to customize the legend spacing and margins:
legend_box- arrangement of multiple legends (“horizontal” or “vertical”);legend_box_just- justification of each legend within the overall bounding box (“top”, “bottom”, “left”, “right”, “center”);legend_box_spacing- spacing between plotting area and legend box;legend_margin- margin around each legend;legend_spacing- spacing between legends,legend_spacing_x/legend_spacing_y- in the horizontal/vertical direction.
p2 = ggplot(df, aes('displ', 'cty')) + \
    geom_point(aes(fill='drv', size='hwy'), shape=21) + \
    scale_size(range=[1, 10], breaks=[15, 30, 40]) + \
    theme(legend_position='bottom', legend_background=element_rect(size=1))
p2
# legend_margin
p2 + theme(legend_margin=[10, 20])
# legend_box
p2 + theme(legend_box='horizontal')
# legend_box_just
p2 + theme(legend_box_just='center')
# legend_box_spacing
p2 + theme(legend_box='horizontal',  legend_box_spacing=50)
# legend_spacing
p2 + theme(legend_box='horizontal', legend_spacing_x=50)
Legend Key Parameters#
Parameters to customize the legend key:
legend_key- background underneath legend keys, set withelement_rect();legend_key_size- size of legend keys;legend_key_width- key background width;legend_key_height- key background height;legend_key_spacing- spacing between legend keys;legend_key_spacing_x- spacing in the horizontal direction;legend_key_spacing_y- spacing in the vertical direction.
p3 = ggplot(df, aes(x='hwy')) + \
    geom_dotplot(aes(fill='class'), color='pen') + \
    theme(legend_background=element_rect(size=0.5))
p3
Add background underneath legend keys:
p4 = p3 + theme(legend_key=element_rect(fill='#efedf5', color='#756bb1'))
p4
Change size of legend keys:
p4 + theme(legend_key_size=30)
p5 = p4 + theme(legend_key_width=80, legend_key_height=20)
p5
Add spacing between legend keys:
p5 + theme(legend_key_spacing_y=10)