Theme Flavors#
from IPython.display import Image
import pandas as pd

from lets_plot import *
LetsPlot.setup_html()
mpg_df = pd.read_csv("https://raw.githubusercontent.com/JetBrains/lets-plot-docs/master/data/mpg.csv")
mpg_df
| Unnamed: 0 | manufacturer | model | displ | year | cyl | trans | drv | cty | hwy | fl | class | |
|---|---|---|---|---|---|---|---|---|---|---|---|---|
| 0 | 1 | audi | a4 | 1.8 | 1999 | 4 | auto(l5) | f | 18 | 29 | p | compact |
| 1 | 2 | audi | a4 | 1.8 | 1999 | 4 | manual(m5) | f | 21 | 29 | p | compact |
| 2 | 3 | audi | a4 | 2.0 | 2008 | 4 | manual(m6) | f | 20 | 31 | p | compact |
| 3 | 4 | audi | a4 | 2.0 | 2008 | 4 | auto(av) | f | 21 | 30 | p | compact |
| 4 | 5 | audi | a4 | 2.8 | 1999 | 6 | auto(l5) | f | 16 | 26 | p | compact |
| ... | ... | ... | ... | ... | ... | ... | ... | ... | ... | ... | ... | ... |
| 229 | 230 | volkswagen | passat | 2.0 | 2008 | 4 | auto(s6) | f | 19 | 28 | p | midsize |
| 230 | 231 | volkswagen | passat | 2.0 | 2008 | 4 | manual(m6) | f | 21 | 29 | p | midsize |
| 231 | 232 | volkswagen | passat | 2.8 | 1999 | 6 | auto(l5) | f | 16 | 26 | p | midsize |
| 232 | 233 | volkswagen | passat | 2.8 | 1999 | 6 | manual(m5) | f | 18 | 26 | p | midsize |
| 233 | 234 | volkswagen | passat | 3.6 | 2008 | 6 | auto(s6) | f | 17 | 26 | p | midsize |
234 rows × 12 columns
Flavors Demonstration#
p = ggplot(mpg_df, aes("cty","hwy", color='drv')) + \
    geom_point(tooltips=layer_tooltips().line('@manufacturer @model'))
p2 = p + facet_grid(y="drv")
def theme_with_flavor(plot, theme, title):
    return gggrid([
        plot + theme + ggtitle(title),
        plot + theme + flavor_darcula()+ ggtitle("darcula"),
        plot + theme + flavor_solarized_light()+ ggtitle("solarized_light"),
        plot + theme + flavor_solarized_dark()+ ggtitle("solarized_dark"),
        plot + theme + flavor_high_contrast_light() + ggtitle("high_contrast_light"),
        plot + theme + flavor_high_contrast_dark() + ggtitle("high_contrast_dark"),
    ], ncol=2) + ggsize(800, 800)
theme_with_flavor(p, theme_minimal2(), "minimal2")
theme_with_flavor(p2, theme_minimal2(), "minimal2 + facet_grid")
theme_with_flavor(p, theme_minimal(), "minimal")
theme_with_flavor(p2, theme_minimal(), "minimal + facet_grid")
theme_with_flavor(p, theme_classic(), "classic")
theme_with_flavor(p2, theme_classic(), "classic + facet_grid")
theme_with_flavor(p, theme_light(), "light")
theme_with_flavor(p2, theme_light(), "light + facet_grid")
theme_with_flavor(p, theme_grey(), "grey")
theme_with_flavor(p2, theme_grey(), "grey + facet_grid")
theme_with_flavor(p, theme_void(), "void")
theme_with_flavor(p2, theme_void(), "void + facet_grid")
theme_with_flavor(p, theme_none(), "none")
theme_with_flavor(p2, theme_none(), "none + facet_grid")
theme_with_flavor(p, theme_bw(), "bw")
theme_with_flavor(p2, theme_bw(), "bw + facet_grid")
Returning to the Theme Defaults with flavor_standard()#
Use flavor_standard() to override other flavors or to make defaults explicit.
# A reusable style layer for consistent plots across the project.

proj_theme = (
    theme_classic() +
    theme(
        axis_title=element_text(size=13),
        axis_text=element_text(size=15),
        legend_position="left",
        axis_ticks_length=7,
        panel_grid_major=element_line(color="spring_green"),
        panel_grid_minor=element_blank()
    ) + flavor_darcula()
)

LetsPlot.set_theme(proj_theme)
# A base plot with the common project style
proj_plot = ggplot(mpg_df, aes("cty","hwy", color='drv')) + \
geom_point(tooltips=layer_tooltips().line('@manufacturer @model')) + \
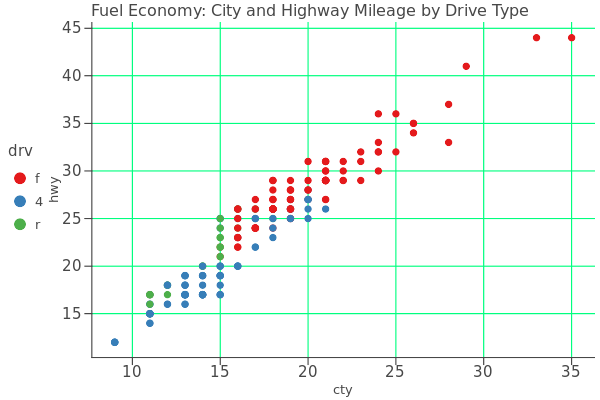
ggtitle("Fuel Economy: City and Highway Mileage by Drive Type")
proj_plot
# To restore the theme defaults without affecting other settings, apply flavor_standard().
# This can be useful, for example, when exporting the plot for printing.

fullpath_png = ggsave(proj_plot + flavor_standard(), "plot_without_flavor.png", scale=1)

Image(filename=fullpath_png)